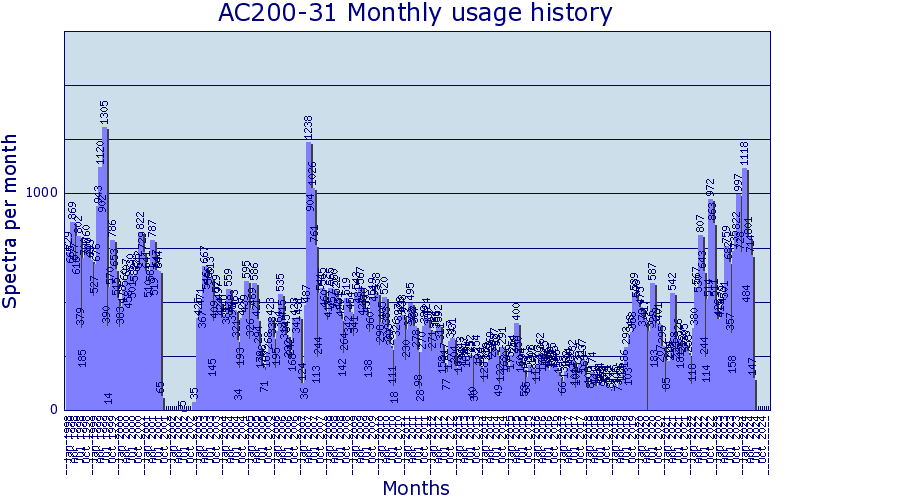
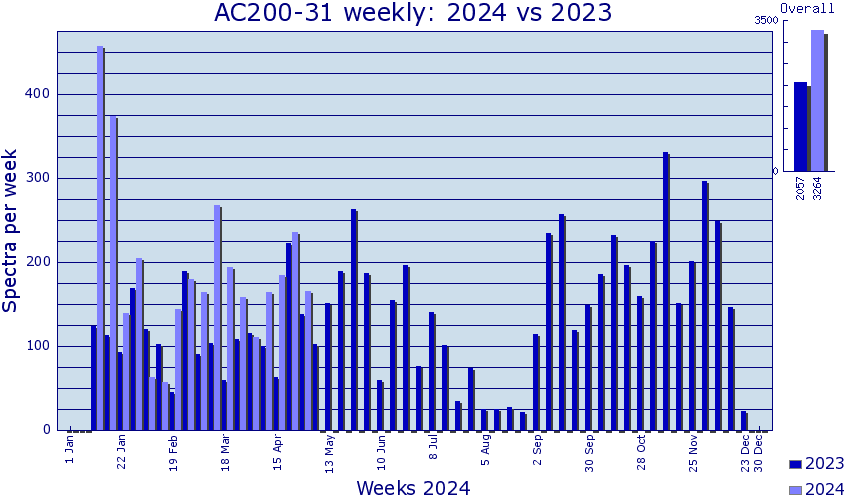
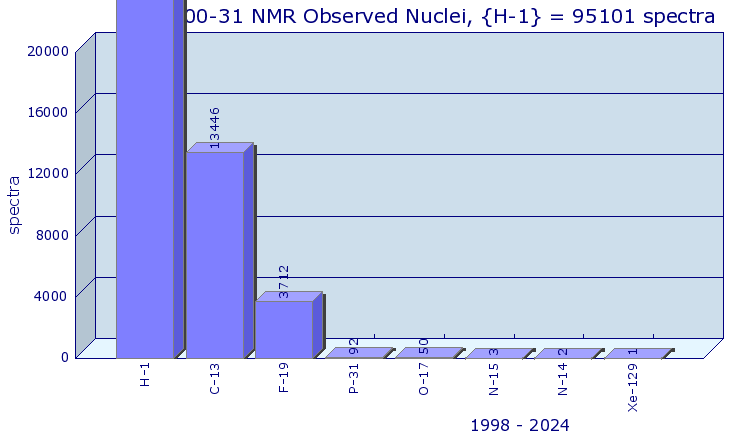
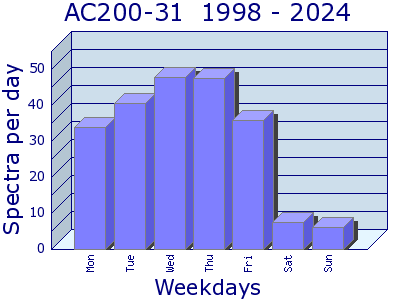
Bruker AC200-31 Statistics


Untitled Document
Summary graph
Statistics start date: 1 January 1998
Date of last record: 18 April 2024
Spectra registered in 2024: 2863
Total spectra in 1998 - 2024: 112003
2D Spectra in 1998 - 2024: 0
3D Spectra in 1998 - 2024: 0
Maximum spectra per day: 296 (6 March 1998)
Maximum spectra per week: 465 (week start 28 Nov 2022)
Maximum spectra per month: 1305 (Jun 1999)
Maximum spectra per year: 8401 (1999)

Summary graph


Compare current and previous years

Summary graph
Note: Small graph at the right upper corner of the diagram show number of spectra, registered since 1-st Jan of current year comparing with corresponding period of the previous year.


All nuclei observed at the spectrometer AC200-31

Summary graph annually

Spectra per weekdays at AC200-31

Summary graph annually


Other graphs for Bruker AC200-31

Helium level Field drift X,Y,Z-shims drift

Similar graphs for other instruments

Bruker AC200-33 Bruker AM-300
Bruker DRX-500 Bruker WM-250
Bruker AV600

NMR Center statistics page

NMR Center homepage

This pages are generated automatically once a day.
All data and images are copyright © 1998-2009 of NMR Center of IOCh RAS.
Report software by Dmitry E. Dmitriev Copyright © 2001