Bruker WM250 Statistics

| ||
| Statistics start date: | 8 January 1998 | |
| Date of last record: | 29 March 2007 | |
| Spectra registered in 2026: | 0 | |
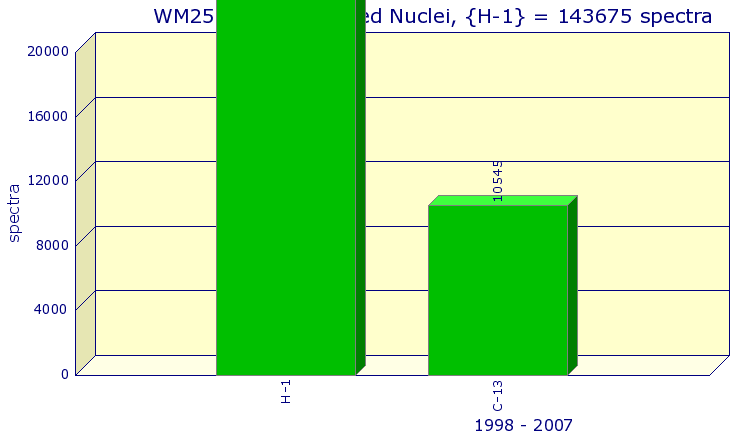
| Total spectra in 1998 - 2007: | 149269 | |
| 2D Spectra in 1998 - 2007: | 0 | |
| 3D Spectra in 1998 - 2007: | 0 | |
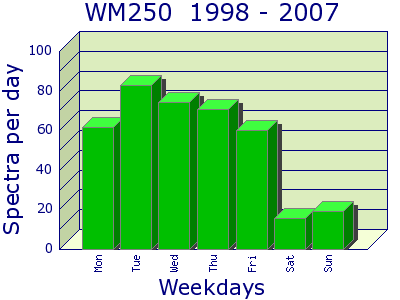
| Maximum spectra per day: | 810 (17 October 2006) | |
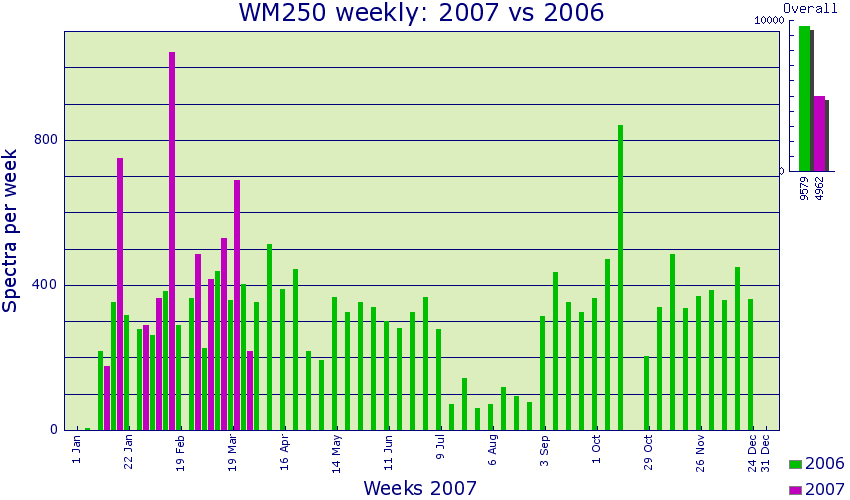
| Maximum spectra per week: | 1038 (week start 12 Feb 2007) | |
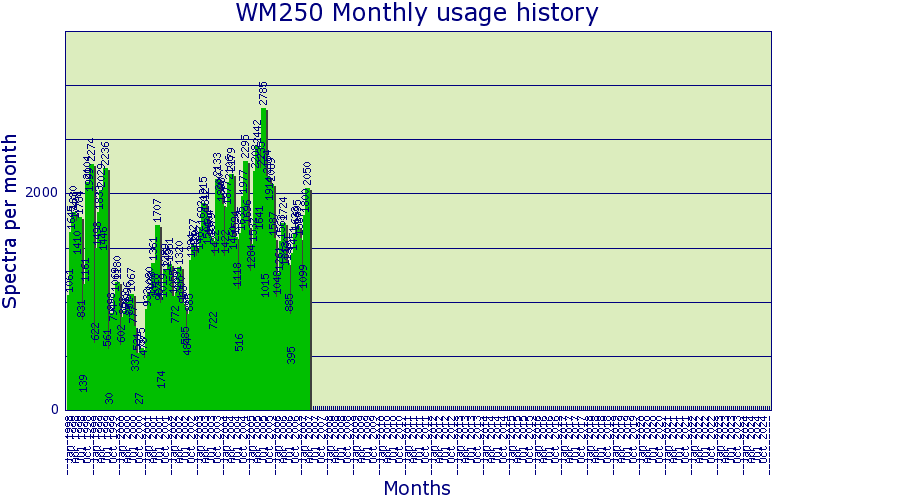
| Maximum spectra per month: | 2785 (Jul 2005) | |
| Maximum spectra per year: | 22897 (2005) |